
There is often the requirement to evaluate descriptive statistics for data within the

There is often the requirement to evaluate descriptive statistics for data within the organization or for health care information. Every year the National Cancer Institute collects and publishes data based on patient demographics. Understanding differences between the groups based upon the collected data often informs health care professionals towards research, treatment options, or patient education.
Using the data on the “National Cancer Institute Data” Excel spreadsheet, calculate the descriptive statistics indicated below for each of the Race/Ethnicity groups. Refer to your textbook and the Topic Materials, as needed, for assistance in with creating Excel formulas.
Provide the following descriptive statistics:
- Measures of Central Tendency: Mean, Median, and Mode
- Measures of Variation: Variance, Standard Deviation, and Range (a formula is not needed for Range).
- Once the data is calculated, provide a 150-250 word analysis of the descriptive statistics on the spreadsheet. This should include differences and health outcomes between groups.
APA style is not required, but solid academic writing is expected.
This assignment uses a rubric. Please review the rubric prior to beginning the assignment to become familiar with the expectations for successful completion.
You are not required to submit this assignment to LopesWrite.
Expert Answer and Explanation
Alternative Expert Answer and Explanation
Measures of Central Tendency: Mean, Median, and Mode
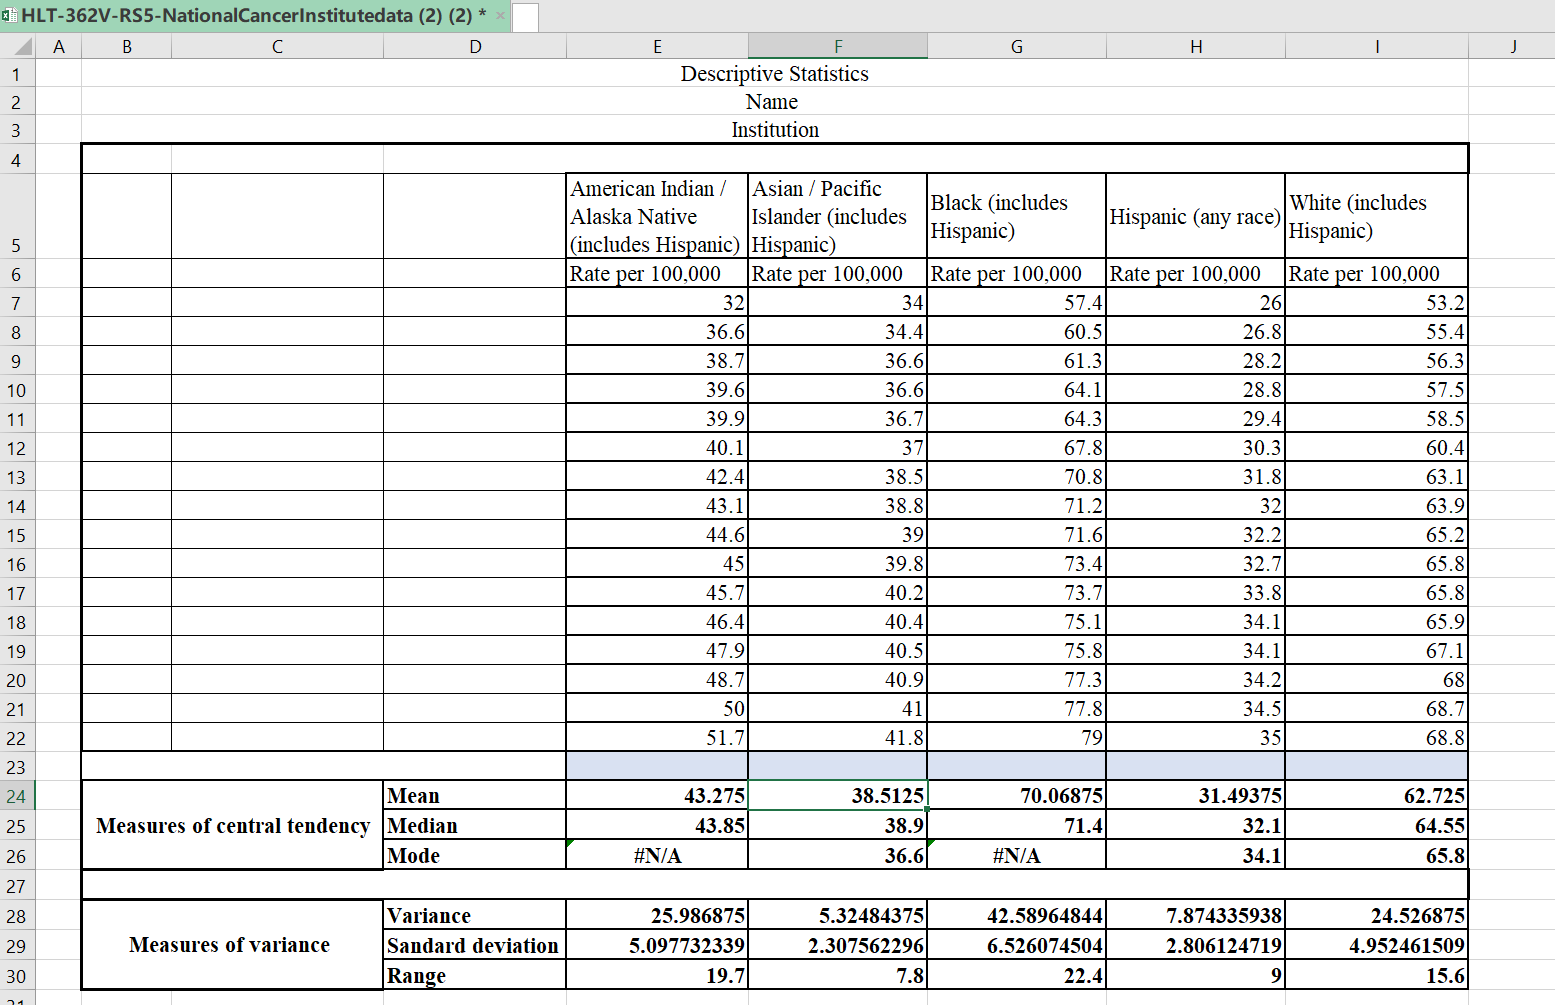
This paper will elaborate on the descriptive statistical analysis for lung and bronchus cancer for the different racial groups as contained in the National Cancer Institute (2018). The data compiled was from the years 2000 to 2015.
Mean
Mean, also known as average, is the total summation of the values given divided by the number of items in a data set (Grove & Gray, 2018). The following is a mean for the different racial groups:
Mean = Σ/n. where Σ is the total sum of the rate per 100,000, and n is the number of years (16 years).
American Indian / Alaska Native (includes Hispanic)
Mean = 692.4/16 = 43.275
Asian / Pacific Islander (includes Hispanic)
Mean = 616.2/16 = 38.5125
Black (includes Hispanic)
Mean = 1121.1/16 = 70.06875
Hispanic (any race)
Mean = 503.9/16= 31.49375
White (includes Hispanic)
Mean = 1003.6/16=62.725
Median
Median is defined as the middle number in a data set (Grove & Gray, 2018). Given that the data set used by this paper contains an even number of items, one can get the median by calculating the average of the two middle numbers. The median for the following racial groups is calculated as follows
American Indian / Alaska Native (includes Hispanic)
Median = (43.1+44.6)/2 = 43.85
Asian / Pacific Islander (includes Hispanic)
Median = (38.8+39)/2 = 38.9
Black (includes Hispanic)
Median = (71.2+71.6)/2 =71.4
Hispanic (any race)
Median = (32+32.2)/2 =32.1
White (includes Hispanic)
Median = (63.9+65.2)/2 = 64.55
Mode
Mode is defined as the most repeated number in a data set. In case a modal value can’t be established, one is supposed to group the data values, and using the following formula; the modal value for the group can be identified.
Mode = L + (fm − fm-1) / ((fm − fm-1) + (fm − fm+1)) × W
where:
- L is the lower-class boundary of the modal group
- fmis the frequency of the modal group
- fm-1is the frequency of the group before the modal group
- fm+1is the frequency of the group after the modal group
- w is the group width
American Indian / Alaska Native (includes Hispanic)
Data Groups 31-40 frequency = 6, 41-50 frequency = 9, 51-60 frequency = 1
The modal estimation for this population group is
Mode = 41+ (9 − 6) / ((9 − 6) + (9 − 1)) × 10 = 41 +3/11 x 10 = 43.73
Ans = 43.73
Asian / Pacific Islander (includes Hispanic)
The mode for this population group is 36,6
Black (includes Hispanic)
Data Groups 55-60 frequency = 2, 61-65 frequency =3, 66-70 frequency =2, 71-75 frequency =6, 76–80 frequency = 3
The modal estimation for this population group is
Mode = 71+ (6 − 2) / ((6 − 2) + (6 − 3)) × 5 = 71 +4/7 x 10 = 76.71
Ans = 76.71
Hispanic (any race)
The mode for this population group is 34.1
White (includes Hispanic)
The mode for this population group is 65.8
Measures of Variation:
Variance
Variance is the measurement of how numbers are distributed in a given data set. The following is a formula used to calculate variance;
Σ (Xi – μ) 2 / n.
Where:
Σ is summation of the items
n is the total number of items in the data set.
Xi is the individual figures in the data set,
μ is the mean for that data set,
The following is the variance for the given racial groups
American Indian / Alaska Native (includes Hispanic)
μ = 43.275
| Xi | (μ – Xi)2 |
| 32 | 127.125625 |
| 36.6 | 44.555625 |
| 38.7 | 20.930625 |
| 39.6 | 13.505625 |
| 39.9 | 11.390625 |
| 40.1 | 10.080625 |
| 42.4 | 0.765625 |
| 43.1 | 0.030625 |
| 44.6 | 1.755625 |
| 45 | 2.975625 |
| 45.7 | 5.880625 |
| 46.4 | 9.765625 |
| 47.9 | 21.390625 |
| 48.7 | 29.430625 |
| 50 | 45.225625 |
| 51.7 | 70.980625 |
| Σ =415.79 |
Variance = 415.79/16 = 25.986875
Asian / Pacific Islander (includes Hispanic)
μ = 38.5125
| Xi | (μ – Xi)2 |
| 34 | 20.36265625 |
| 34.4 | 16.91265625 |
| 36.6 | 3.65765625 |
| 36.6 | 3.65765625 |
| 36.7 | 3.28515625 |
| 37 | 2.28765625 |
| 38.5 | 0.00015625 |
| 38.8 | 0.08265625 |
| 39 | 0.23765625 |
| 39.8 | 1.65765625 |
| 40.2 | 2.84765625 |
| 40.4 | 3.56265625 |
| 40.5 | 3.95015625 |
| 40.9 | 5.70015625 |
| 41 | 6.18765625 |
| 41.8 | 10.80765625 |
| Σ =85.1975 |
Variance = 85.1975/16 = 5.32484375
Black (includes Hispanic)
μ = 38.5125
| Xi | (μ – Xi)2 |
| 57.4 | 160.4972266 |
| 60.5 | 91.56097656 |
| 61.3 | 76.89097656 |
| 64.1 | 35.62597656 |
| 64.3 | 33.27847656 |
| 67.8 | 5.147226562 |
| 70.8 | 0.534726563 |
| 71.2 | 1.279726563 |
| 71.6 | 2.344726563 |
| 73.4 | 11.09722656 |
| 73.7 | 13.18597656 |
| 75.1 | 25.31347656 |
| 75.8 | 32.84722656 |
| 77.3 | 52.29097656 |
| 77.8 | 59.77222656 |
| 79 | 79.76722656 |
| Σ = 681.4344 |
Variance = 681.4344/16 = 42.58965
Hispanic (any race)
μ = 31.49375
| Xi | (μ – Xi)2 |
| 26 | 30.18128906 |
| 26.8 | 22.03128906 |
| 28.2 | 10.84878906 |
| 28.8 | 7.256289062 |
| 29.4 | 4.383789063 |
| 30.3 | 1.425039062 |
| 31.8 | 0.093789063 |
| 32 | 0.256289063 |
| 32.2 | 0.498789063 |
| 32.7 | 1.455039063 |
| 33.8 | 5.318789062 |
| 34.1 | 6.792539063 |
| 34.1 | 6.792539063 |
| 34.2 | 7.323789063 |
| 34.5 | 9.037539063 |
| 35 | 12.29378906 |
| Σ =125.989375
|
Variance = 125.989375/16 = 7.8743359375
White (includes Hispanic)
μ = 38.5125
| Xi | (μ – Xi)2 |
| 53.2 | 90.725625 |
| 55.4 | 53.655625 |
| 56.3 | 41.280625 |
| 57.5 | 27.300625 |
| 58.5 | 17.850625 |
| 60.4 | 5.405625 |
| 63.1 | 0.140625 |
| 63.9 | 1.380625 |
| 65.2 | 6.125625 |
| 65.8 | 9.455625 |
| 65.8 | 9.455625 |
| 65.9 | 10.080625 |
| 67.1 | 19.140625 |
| 68 | 27.825625 |
| 68.7 | 35.700625 |
| 68.8 | 36.905625 |
| Σ =392.43 |
Variance = 392.43/16 = 24.526875
Standard Deviation
Standard deviation (SD) is calculated by finding the square root of variance; the following is the SD for each of the racial groups;
American Indian / Alaska Native (includes Hispanic)
SD = √25.986875 = 5.097732
Asian / Pacific Islander (includes Hispanic)
SD = √5.32484375 = 2.307562
Black (includes Hispanic)
SD = √42.58965 = 6.526075
Hispanic (any race)
SD = √7.8743359375 =2.8061247
White (includes Hispanic)
SD = √24.526875 = 4.9524615
Range.
The following is the range for the given racial groups
American Indian / Alaska Native (includes Hispanic)
Range = 51.7- 32 = 19.7
Asian / Pacific Islander (includes Hispanic)
Range = 41.8- 34 = 7.8
Black (includes Hispanic)
Range = 79- 57.4 = 22.4
Hispanic (any race)
Range = 35- 26 = 9
White (includes Hispanic)
Range = 68.8- 53.2 = 15.6
Summary of the descriptive statistics
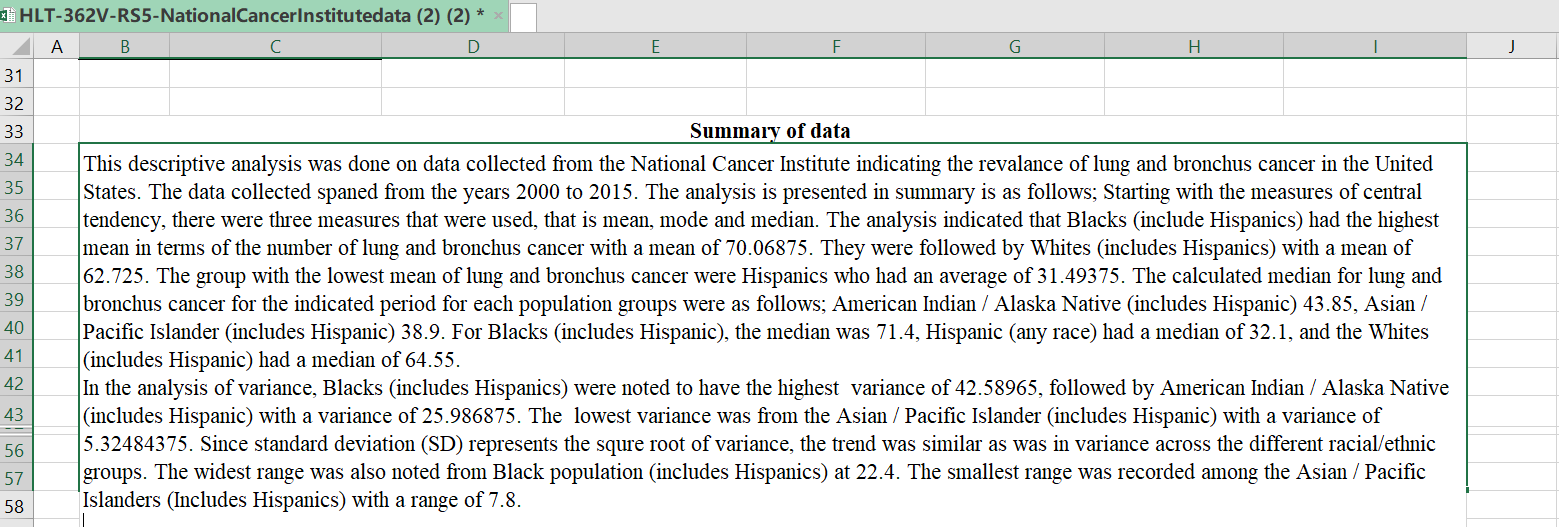
The following is a summary of the results obtained from the statistical analysis of lung and bronchus cancer cases in the US for the periods between 2000 and 2015. The statistical analysis which was conducted using descriptive statistics included two major components i.e., measures of central tendency (mean mode and median) and measures of variance (standard deviation, variance and range).
From the analysis it was found out that the African American population had the highest mean in terms of the number of lung and bronchus cancer at 70.06875. This was followed by non-Hispanic Whites who had the second highest mean of 62.725. The Hispanic population had the least mean of 31.49375.
With regards to the median rate for lung and bronchus cancer, it was noted that the American Indian / Alaska Native (includes Hispanic) had a median of 43.85, Asian / Pacific Islander (includes Hispanic) had a median of 38.9. For Blacks (includes Hispanic), the median was 71.4, while the Hispanic (any race) had a median of 32.
1. Lastly, the Whites (includes Hispanic) had a median of 64.55.
from the analysis of variance, it was established that, Blacks had the highest level of variance at 42.58965 with the second highest being American Indian / Alaska Native (includes Hispanic) with a variance of 25.986875. The Asian / Pacific Islander (includes Hispanic) had the least variance at 5.32484375.
The widest range was noted from Black population at 22.4, with the e Asian / Pacific Islanders recording the smallest range of 7.8.

FAQs
Descriptive statistics for data analysis
Descriptive statistics is a branch of statistics that involves the collection, organization, analysis, interpretation, and presentation of data. It provides a way to summarize and describe the main features of a dataset. The main objective of descriptive statistics is to provide a clear and concise summary of data in order to make it more understandable and usable for decision making.
There are several key measures used in descriptive statistics to analyze a dataset. Some of the most commonly used measures are:
- Measures of central tendency: These measures describe the typical or central value of a dataset. The three most common measures of central tendency are the mean, median, and mode.
- Measures of dispersion: These measures describe the spread or variability of the data. The most commonly used measures of dispersion are the range, variance, and standard deviation.
- Measures of shape: These measures describe the shape of the distribution of the data. The most commonly used measures of shape are skewness and kurtosis.
- Frequency distribution: A frequency distribution is a table that shows how often each value or range of values occurs in a dataset.
- Graphical representations: Graphical representations such as histograms, box plots, and scatter plots are commonly used to visualize and summarize data.
Descriptive statistics can be used in a variety of fields, including business, economics, psychology, medicine, and many others. It is a valuable tool for analyzing and interpreting data, as it helps researchers and decision makers to better understand the characteristics of a dataset and to make more informed decisions based on the data.
10 uses of health statistics
Health statistics play a crucial role in various aspects of healthcare, public health, and research. Here are 10 important uses of health statistics:
- Disease Surveillance:
- Health statistics are used to monitor and track the incidence and prevalence of diseases within populations. This information is vital for early detection of outbreaks and the implementation of public health interventions.
- Public Health Planning:
- Governments and healthcare organizations use health statistics to plan and allocate resources effectively. This includes determining the distribution of healthcare facilities, personnel, and preventive services based on the health needs of the population.
- Policy Development:
- Health statistics inform the development of healthcare policies at local, national, and international levels. Policymakers rely on data to make informed decisions about healthcare infrastructure, funding, and regulatory measures.
- Clinical Research:
- In clinical research, health statistics are essential for designing studies, analyzing outcomes, and drawing conclusions. Researchers use statistical methods to assess the effectiveness of treatments, identify risk factors, and improve patient care.
- Epidemiological Studies:
- Epidemiologists utilize health statistics to investigate patterns of diseases and their determinants within populations. This includes studying risk factors, prevalence, and distribution to identify trends and potential interventions.
- Resource Allocation:
- Health statistics guide the allocation of financial and human resources. Governments and healthcare organizations use data on disease burden and population health to prioritize areas that require additional resources or interventions.
- Monitoring Health Inequalities:
- Health statistics help identify disparities in health outcomes among different demographic groups. This information is crucial for addressing health inequalities and developing targeted interventions to improve health equity.
- Health Promotion and Education:
- Health statistics are used to design and implement health promotion campaigns and educational programs. Understanding health trends allows for the development of targeted messages to raise awareness and encourage healthier behaviors.
- Healthcare Quality Improvement:
- Hospitals and healthcare providers use health statistics to assess the quality of care. Patient outcomes, satisfaction, and adherence to clinical guidelines are measured and analyzed to identify areas for improvement in healthcare delivery.
- Health Economics:
- Health statistics are essential for health economics research, which examines the economic aspects of healthcare systems. This includes cost-effectiveness analyses, resource utilization studies, and assessments of the economic impact of health interventions.
What is the importance of health statistics in nursing?
Health statistics play a crucial role in nursing practice, contributing to evidence-based care, informed decision-making, and the overall improvement of healthcare delivery. Here are several key aspects highlighting the importance of health statistics in nursing:
- Patient Assessment and Care Planning:
- Health statistics provide nurses with valuable data to assess the health status of individuals and populations. This information guides the development of personalized care plans, taking into account the prevalence of specific health conditions, risk factors, and demographic factors.
- Evidence-Based Practice:
- Nurses use health statistics to inform their practice based on the best available evidence. By staying updated on health trends, treatment outcomes, and research findings, nurses can implement interventions that have proven effectiveness, leading to improved patient outcomes.
- Disease Prevention and Health Promotion:
- Health statistics help nurses identify patterns of diseases and health risks within communities. Armed with this information, nurses can develop and implement preventive strategies and health promotion programs to address specific health concerns and encourage healthier lifestyles.
- Monitoring and Evaluation:
- Nurses utilize health statistics to monitor the effectiveness of interventions and evaluate patient outcomes. This continuous evaluation process enables them to make real-time adjustments to care plans, ensuring that patients receive the most effective and efficient care.
- Resource Allocation:
- Understanding health statistics is essential for optimizing the allocation of healthcare resources. Nurses, particularly those in leadership roles, use data on patient demographics, disease prevalence, and healthcare utilization to plan staffing levels, allocate supplies, and manage budgets effectively.
- Quality Improvement Initiatives:
- Health statistics contribute to ongoing quality improvement efforts in healthcare. By analyzing data related to patient safety, satisfaction, and outcomes, nurses can identify areas for improvement and implement evidence-based practices to enhance the overall quality of care.
- Infection Control:
- Nurses rely on health statistics to track and manage infectious diseases within healthcare settings. Monitoring infection rates, identifying trends, and understanding patterns of transmission are essential for implementing effective infection control measures and maintaining a safe environment for patients and healthcare providers.
- Public Health Collaboration:
- Nurses often work collaboratively with public health professionals to address community health issues. Health statistics provide a common language for interdisciplinary collaboration, allowing nurses to contribute their expertise in patient care to broader public health initiatives.
- Advocacy and Health Policy:
- Nurses can leverage health statistics to advocate for policy changes and improvements in healthcare delivery. Data-driven advocacy helps nurses articulate the needs of their patients and communities, influencing health policies at local, regional, and national levels.
- Continuing Education and Professional Development:
- Health statistics contribute to the ongoing education and professional development of nurses. Staying informed about evolving health trends, new treatment modalities, and research findings ensures that nurses remain well-equipped to provide high-quality, evidence-based care.
Statistics on workplace violence in healthcare
Workplace violence in healthcare is a concerning issue that affects the well-being of healthcare workers. While the prevalence of workplace violence can vary, especially across different healthcare settings and regions, here are some general statistics to provide an overview:
- Prevalence of Workplace Violence:
- According to the Occupational Safety and Health Administration (OSHA), healthcare and social service workers are at an increased risk of workplace violence. They account for a significant portion of reported workplace violence incidents.
- Percentage of Healthcare Workers Affected:
- The Bureau of Labor Statistics (BLS) reported that in 2019, healthcare and social assistance workers experienced 73% of all nonfatal workplace injuries and illnesses due to violence. This indicates a substantial impact on the healthcare sector.
- Types of Workplace Violence:
- The National Institute for Occupational Safety and Health (NIOSH) categorizes workplace violence in healthcare into four types: Type I (Criminal Intent), Type II (Client-on-Worker), Type III (Worker-on-Worker), and Type IV (Personal Relationship).
- Patient-Related Violence:
- A study published in the Journal of Emergency Nursing found that patient-related violence accounted for a significant proportion of workplace violence incidents in emergency departments. The study reported a range of 21.3% to 75.5% of nurses experiencing verbal or physical abuse from patients.
- Violence Against Nurses:
- The American Nurses Association (ANA) reported that nearly 25% of nurses have been physically assaulted at work, and about 50% have been verbally abused. These incidents can have a significant impact on the mental and physical well-being of nurses.
- Underreporting of Incidents:
- Workplace violence incidents in healthcare are often underreported. According to OSHA, many healthcare workers do not report incidents due to concerns about retaliation, the belief that violence is part of the job, or a lack of awareness about reporting procedures.
- Risk Factors:
- The Emergency Nurses Association (ENA) highlights several risk factors for workplace violence in healthcare, including working in emergency departments, psychiatric units, or long-term care settings. The risk is also higher during periods of high patient acuity and when there are inadequate security measures in place.
- Consequences of Workplace Violence:
- The consequences of workplace violence in healthcare extend beyond the immediate physical harm. A study published in the Journal of Interpersonal Violence reported that healthcare workers who experienced violence had higher levels of emotional exhaustion, depersonalization, and reduced personal accomplishment.
- Preventive Measures:
- Organizations are increasingly implementing preventive measures to address workplace violence in healthcare. These measures include training programs, security enhancements, and the development of clear reporting mechanisms.

I am a professional nursing assignment expert offering comprehensive academic support to university nursing students across various institutions. My services are designed to help learners manage their workload effectively while maintaining academic excellence. With years of experience in nursing research, case study writing, and evidence-based reporting, I ensure every paper is original, well-researched, and aligned with current academic standards.
My goal is to provide dependable academic assistance that enables students to focus on practical training and career growth.
Contact me today to receive expert guidance and timely, high-quality nursing assignment help tailored to your academic needs.